Being shocked is not very pleasant, but being in an aftershock is even worse. February 21, 2011 around noon, 400,000 people were encountered with a massive earthquake. This 6.3 earthquake was actually a reverb of an earthquake that happened last year. New Zealand’s Prime Ministe says “This is New Zealand’s darkest day.” This quake has reportedly taken the lives of 65 people, and counting. The tremble of this earthquake basically flattened the city, destroying buildings and historical monuments. People say that this earthquake could hurt New Zealand’s fragile economy. Many say that this is the worst thing that has happened to New Zealand in past 80 years. Most of the earthquakes that happen in New Zealand are hardly felt, and do not cause a lot of damage. Clearly this one did. Every year New Zealand experiences about 15,000 earthquakes, this is not very much compared to 50,000 earthquakes that occur in California each year. Yet only one earthquake can make a big difference in a city. New Zealand is located on the western edge of the Ring of Fire. Any type of movement in the earth’s crust may result in an earthquake, when a country is located around a tectonic plate; it is usually prone to have earthquakes or tsunamis.
What a tragic event, one moment you’re enjoying the sunshine, the next you are ducking under a desk trying to save yourself from the collapsing roof. This just proves that you have to life each day to its fullest! These natural disasters are just big disasters, and some bad luck, but now with improved technology we can prevent the loss of life and damage. There are options that you have that can improve how safe you want to be. Sturdier houses and buildings have been build to protect people’s lives, all we have to do now is put it in action. Taking that extra safety precaution could save your life or someone else’s. Learning and researching could also help you in the future if you were encountered with a natural disaster. This article relates to the unit we are studying because it has to do with earthquakes and tsunamis, all about how waves move through the earth. If we didn’t know about this, the amount of causalities because of these natural disasters would be off-the-charts! The use of technology is very important in this area of science, because it helps us warn others when a earthquake might occur.
I have been in only one earthquake and that was here, in Belgrade, Serbia. That night I woke up to find my room vibrating! At first I was panicked and then I thought it was a dream so I pulled the sheets over my head and hoped that it would stop soon. I guess this wasn’t the safest way to take cover when in an earthquake, but thank goodness it wasn’t a very big earthquake. What if it was? I am so glad that I have learned more about earthquakes, and how they function, so next time if I am in one I will know what to do. After learning more about earthquakes it worries me that some person might do the same thing that I did, but he/she was in a bigger earthquake. What would happen then? I feel that being aware of what an earthquake or any natural disaster can do, is extremely important. If we want to protect ourselves from natural disasters we must start learning about them, and what we can do to stay safe.
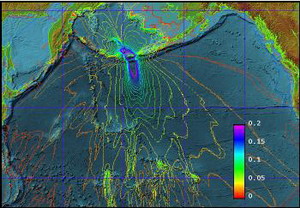
Here are the results from the earthquake.
Sites Used
CNN NewsROOM. "New Zealand: An Earthquake Hotspot - CNN.com." CNN.com International - Breaking, World, Business, Sports, Entertainment and Video News. Web. 23 Feb. 2011. .
The origin of the word “tsunami” is from Japan, meaning harbor wave. Did you know that a tsunami wave can travel more than 500 miles per hour? The enormous wave starts as a disturbance in the ocean’s floor, and as it gradually goes inland it starts to go faster and builds up energy, and once it reaches the shore it creates a high-speed massive wave. Some waves can reach as tall as a ten story building! Natural disasters are an exhilarating phenomenon, ranging from tornadoes, to hurricanes, to earthquakes, they are all scary. That is why I like Colorado, there is not enough water for hurricanes or tsunamis, and the mountains create a protective circle that prevent tornados from coming in too often. The natural disaster that freaks me out the most is tsunamis. It is frightening how many stories that I have heard about tsunamis, and the amount of damage they have created.
The Ring of Fire
Our world is made up of 71% water, in that there are five different oceans- the Pacific Ocean being the largest. The Pacific Ocean is quite a remarkable body of water. Even though its name means the ‘peaceful sea’, the Pacific Ocean is the host of the Ring of Fire. The Ring of Fire is a region in the Pacific Ocean where a large amount of earthquakes occur in the oceans basin. The combination of earthquakes and a large body of water results in many tsunamis. In the past ten years there have been 22 major tsunamis- all in the Ring of Fire. The reason why 80% of all tsunamis happen in the Ring of Fire is the large amount of tectonic change. The increased amount of tectonic movement results in an increased probability of an earthquake.
The most recent earthquake was on the coast of Japan. This December, when the Pacific and Philippine plates clashed together they produced a 7.4 earthquake. The earthquake sent the Pacific Tsunami Warning Center in a race to get the people of the Bonin Islands evacuated out of their homes because of the great risk of a tsunami in their area. This is shows us that scientists and researchers’ still haven’t found a precise monitor that indicates when tsunamis are going to hit.
Forecast Modeling
Even though there isn’t an exact device that calculates when tsunamis are going to take place, scientists have invented different ways of predicting when a tsunami might occur. One way is called forecast modeling a tsunami. This is a great way to monitor the ocean’s waters; scientists place sensors on the ocean floor and when a particularly large amount of swelling or enlargement of water happens in a certain place-this could be an indication of a tsunami. The ocean sensors are extremely responsive and when there is the most miniscule amount of bulge in the water, the sensors send the information to a buoy near the shore. Then the buoy sends the information to a satellite in space. Now scientists are able to monitor the information from the sensors in the ocean.
This is a great way to predict when tsunamis might occur because the sensors send the information sometimes hours before the tsunami could occur. The early warning gives time for the people to evacuate. Forecast Modeling is a useful tool to help measure the swelling of the water. However, not all of the swelling in the ocean causes a tsunami. The con of this mechanism is that it can’t decipher between real swelling from a tsunami or just a lot of water in an area. This results in lot of false-alarms. Although we don’t have a very exact and precise way of monitoring the earth’s waters, at least this is a start to the research of finding an accurate way of predicting when tsunamis are going to occur.
Tsunami Destruction
The destruction from a tsunami is mind boggling. The results of these natural disasters vary from hurtling boats inland to ripping off the roofs of houses. According to National Geographic the worst tsunami in history held enough energy equivalent to 23,000 atomic bombs! In Hiroshima, only one atomic bomb was dropped and it destroyed a whole city-imagine what 23,000 atomic bombs could do. Currently we don’t have a precise monitor that warns us when a tsunami is about to hit, what we do have is the ability to think outside the box in order to protect us from the strong waves.
After a mammoth size tsunami in Sir Lanka, universities, governments, and people got together and decided to create a safe house that is very resistant to a tsunami’s mega force.The Safe house is special because of four major components; a concrete core structure, traditional bamboo woven ventilation, a roof structure made up of coconut wood, and finally a raised platform to help the water drain from the house. Universities created these houses out of material that is cheap and easy to get. With these Safe houses not as many people will be on the streets after a tsunami.
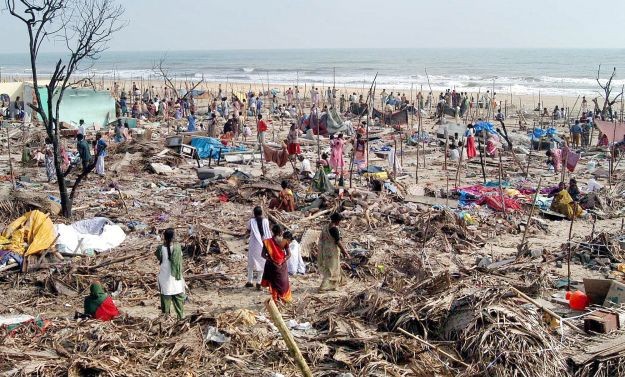
This is a regular house, and with the results from a tsunami are quite bad.
This is an example of a Safe (r) house, and with the impact of a tsunami the house it still standing.
Many Different Impacts
The destruction of a tsunami doesn’t just affect the physical appearance of the country, but also the economy, the society, the culture, and the environment. For countries around the coast, marine fisheries have a big impact on the economy. During a tsunami the strong waves severely damage the boats, gear and the fish itself. Studies show that after the tsunami the fish can be half its original size! After a tsunami in Thailand almost 80% of the counties fishing boats were completely destroyed.
Another outcome from tsunamis is the decrease of tourism. Many times people go to countries because of the beautiful beaches and waters. Tsunamis have a great impact on tourism. After a tsunami hits a city, I am not sure if many people will be too desperate to go to that country. In Thailand after a tsunami, twenty percent of the coral reefs were completely destroyed, and 60% of the coral reefs were knocked over. If this was not handled quickly forty percent of the coral would not have survived. The tsunami left Thailand’s shores cluttered with strayed debris of various parts of cars, boats, and roofs. The government is also affected from tsunamis. Think of when you are desperately trying to clean up your room before your mom comes home, and the only thing that you are thinking of is trying to clean up your room. This is what happens to a government when a natural disaster occurs; everyone’s so busy trying to clean up everything they don’t think of much else. Once a government is only thinking of one thing, they become unstable with things they need to focus on.
Tsunami Warning Systems
When an unknown tsunami is about to hit, it is essential to have some sort of warning system. Warning systems help prevent the destruction of buildings and the loss of life. When a tsunami is detected various alarms go off warning people about the tsunami. There are two types of warnings systems, the Regional Warning System and the International Warning System. The Regional Warning System uses local seismic data to decide whether a tsunami is going to occur. The Regional Warning System alerts people in the local area with sirens. The problem with these warning systems (just like the forecast modeling system), a lot of false-alarms can occur.The International Warning System uses data from many other countries to determine if a tsunami is going to occur. Both of these systems are extremely important to have in order to keep everyone safe.
Being Safe in a Tsunami
When you put all of this together, the most important part when in a tsunami is being safe. Here are some tips of being safe in a tsunami.
1.Move to a higher ground immediately.
2.When traveling to a higher ground it is recommended to not use a vehicle, going on foot is a lot easier.
3.If it is not possible to go to a higher ground go inland, as far away from the coast as you can.
4.If it is not possible to go inland for to a higher ground, go on to the roof of a concrete building. Concrete is the sturdiest material that is resistant when under a force of a tsunami.
5.If possible stay tuned to the radio for further information about the tsunami.
6.Remember, go to the higher ground!
Works Cited
CNN Wire Staff. "Quake near Japanese Islands Triggers Tsunami Warning - CNN.com." CNN.com International - Breaking, World, Business, Sports, Entertainment and Video News. 21 Dec. 2010. Web. 18 Feb. 2011. .
CSA. "Tsunamis and the International Response: Economic, Social and Environmental Dimensions." CSA. 2005. Web. 18 Feb. 2011. .
Gardier, Lisa. "Tsunami Safety Facts." Web log post. Windows to the Universe. Winter 2005. Web. 18 Feb. 2011. .
National Geographic. "Tsunami Facts, Tsunami Information, Tsunami Videos, Tsunami Photos - National Geographic." Tsunami Facts, Tsunami Information, Tsunami Videos, Tsunami Photos - National Geographic. Environment Facts, Environment Science, Global Warming, Natural Disasters, Ecosystems, Green Living - National Geographic. Web. 18 Feb. 2011. .
NOAA. "Causes of Tsunamis." NOAA's National Weather Service. Web. 18 Feb. 2011. .
NOAA. "Tsunami Events." NOAA Center for Tsunami Research. Web. 18 Feb. 2011. .
NOAA. "Tsunami Modeling and Research." NOAA Center for Tsunami Research. Web. 18 Feb. 2011. .
"Safe(R) House | Open Architecture Network." Open Architecture Network | Helping Communities Sustainably Improve Living Conditions through Innovative Design and Construction. Web. 18 Feb. 2011. .
University of Cambridge. "Tsunami Thusyanthan." Model Testing of a Tsunami Safe (r) House. Web. .
Washington Edu. "The Tsunami Warning System." Editorial. Tsunami Warning System: 1-2. Earth and Space Sciences at the University of Washington. Web. 18 Feb. 2011. .
1. Using what you learned from the seismograph model in Part 1, develop your own design for a seismograph. Your seismograph should be able to
• Record vibrations continuously for 30 seconds
• Produce a seismogram that can distinguish between gentle and strong earthquakes
• Record seismic readings consistently from trial to trial
2. Sketch your design on a sheet of paper. The make a list of the materials you will need. Materials might include a heavy weight, a roll of paper, a pen, wood blocks, wood woeles, and duct tape.
My Google Sketch-up seismograph (front)
Side View
Side Diagonal
Part 3
Test your seismograph in a series of simulated earthquakes of different strengths. Evaluate how well your seismograph functions. Does it meet the criteria? Make note of any problems.
This is a close up picture of my seismograph showing the pen in the ruler.
I think that my seismograph meets the criteria, the ruler that kept the pen in place really helped the fact that the pen had to be stable. My seismograph was able to keep time for more than 30 seconds, it kept time for about 58 seconds (that was on my second try). My first try I held a time of 30 seconds, the first 15 seconds I went soft and the last 15 seconds I moved the book vigorously. I could definitely see the difference between the big earthquake and the small earthquake.
Based on your tests, decide how you could improve the design of you seismograph.
I think that I could have used a bigger hole for the ruler, it is big enough for a little pen, but if it was a little bigger then the pen would fit perfectly. Also if I had a strip of paper that was wider, I found that when I was shaking the book as hard as I could the pen would go off the paper and onto the book.
Analyze and Conclude
Evaluating: What problems or shortcomings did you encounter with the seismographs you tested in Part 1?Why do you think these problems occurred?
Also if I had a strip of paper that was wider, I found that when I was shaking the book as hard as I could the pen would go off the paper and onto the book. Other than that I think that I had a sold test. Next time I will just cut the strip a little wider.
2. Designing a Solution: How did you incorporate what you learned in Part 1 into your seismograph design in Part 2?
The ruler is a clear ruler, it is hard to see in this picture, but it is there.
In part one I learned that there is a big difference to the seismograph when it is shaken back and forth and side to side. The waves of the seismograph are a lot clearer when you move the book side to side. This time I only shook the book from side to side, I did not shake it back and forth. I also stabilized the way I held the pen, instead of holding it with my hand, I connected a tissue box and ruler to hold the pen. This was it is a lot more stable and more reliable.
3. Troubleshooting: As you designed, built and tested your seismograph, what problems did you encounter? How did you solve these problems?
At first it was hard to correctly stabilize the pen with just the tissue box and tape, but after I remembered that the ruler I had in my hand had a hole big enough to fit a pen inside, everything seemed to fall into place.
4. Working with Design Constraints: What limitations did factors such as gravity, materials, costs,time, or other factors place on the design and functions of your seismograph? How did you solve these problems?
One of my main goals for this experiment was to make a seismograph out of all homemade materials, things that I didn't have to buy. I wanted this project to be completely out of recycled materials. Because of the recycled materials, I don't think it would have predicted a real earthquake, but it still would be cool to make a real seismograph out of recycled things that actually recorded the earths crusts movement!
Evaluation the Impact on Society: Why is it important for scientists around the world to have access to accurate and durable seismograph?
Seismographs are extremely important for every country to have, whether or not the country is very likely to have a earthquake or not. I think that every country should have a seismograph because at least they can help other countries/cities become more prepared for natural disasters like earthquakes. Like many people say: You'd better be safe than sorry!
Can you design and build a seismograph that can record the movements of simulated earthquakes?
Materials
·Large book
·Pencil
·Pen
·2 strips of paper
Procedure
1.With two lab partners, create a model of a seismograph. Begin by placing a large book on a table.
2.Wind a strip of paper about one meter long around a pencil.
3.Hold the pencil with the paper wound around it in one hand. In your other hand, hold a pen against the paper.
4.As you hold the pen steady, have one lab partner slowly pull on the paper so that it slides across the book.
5.After a few seconds, the other lab partner should jiggle the book gently for 10 seconds to model a weak earthquake, and then for 10 seconds to model a strong earthquake.
6.Observe the pen markings on the paper strip. Compare how the seismograph recorded the weak earthquake and the strong earthquake. Record your observations in your notebook.
7.Repeat Steps 1-6 with a new paper strip. Compare the two paper strips to see how consistent your seismograph recordings were. Record your observations.
Observations 1st strip of paper-
Big Earthquake #1
With very “primitive” materials this was a hard experiment to conduct, because of the all the mistakes that could have gone wrong. The paper could have slipped, or could have been pulled in the wrong direction. As I look at my results, I find that both of my two sheets of paper look sort of the same. Both the big and the small are very different from each other, the small earthquake made small lines and the big earthquake made big lines. During the experiment at the time of the big earthquake it was hard to keep my pen on the sheet of paper, it kept going off, next time I think I should make a bigger piece of sheet paper.
Observations 2nd strip of paper-
This was a lot like the 1st observations, this experiment I found to be a lot easier than the first probably because of the fact that this is my second time doing the experiment. This experiment I put a lot of force into the big earthquake and found that many times my pen didn’t recorded any of the earthquake because of the huge amount of force that I put in.
How measuring changes in the land along a fault might help scientists predict earthquakes?
Predicting when an earthquake is going to occur is pretty hard at times, this is why scientists have invented fault monitors, this includes; laser-ranging devices, creep meters, tilt meters and GPS satellites. These optimal ways help scientists warn people like you and me get ready for upcoming earthquakes. Because the earths crust is made up of many individual blocks it creates many complex reactions then causing earthquakes. Here are some devices that help predict the earths movement.
Tilt Meters
Tiltmeters are used to monitor changes in the tilt of a structure of a fault boundary. If a slope is moving, a tiltmeter can conclude the areas that are deformed and the direction of the faults movement.
Laser- Ranging Device
This is a device that produces lasers that reflect of a reflector to indicate fault movement. The laser-ranging device calculates the time need for the laser beam to bounce off a reflector and return back to the observatory.
Creep Meter
This is a device that helps scientists tell how much movement goes on in a slow moving object, like rocks. This can sometimes help scientists predict when avalanches and earthquakes are going to occur. This is a device that is used to measure strike-slip faults. This device only measures horizontal movements.
GPS
The radio waves from the satellite are bounced off in the angle of incidence from the earths surface. When the wave is bounced back in the angle of reflection, the satellite records them. The time it takes to complete the circuit of angle of incidence and angle of reflection is the exact measurements of the Earth's surface. This is how scientists monitor the earths faults with a GPS.
With these different types of devices scientists can figure out how much stress is in the rocks at that moment and create a hypothesis of when a earthquake might occur or where an earthquake is more likely to occur. This devices help us to protect ourselves from dangerous natural disasters. With new and improved technologies we can learn from each other how to survive in a world of questions. Hopefully in the next few year scientists or someone can invent something that predicts when earthquakes are going to happen. For now, lets just stay safe.
Here is a video about possible theories about when earthquakes occur.
The Epicenter was in Tennessee. The Denver seismograph felt the earthquake about 1170 miles away from the focus and the epicenter. The city on the map which the epicenter is closest is about 100 kilometers. The first city that felt the quake was Chicago, and the last city that felt the quake was Denver. When looking at the map I can see that the Chicago is a lot closer to the epicenter than any other city listed that felt the earthquake. San Francisco is about 2,800 kilometers away from the epicenter. From the data it shows that the farther away from the epicenter the longer it takes the P and S waves to arrive. When the distance increases from the epicenter the longer the difference P and S waves arrive. It is necessary to know the distance between the three recording centers so that you can figure out the distance between the P and S waves. This is the way where you can find the distance to the Epicenter. The epicenter in this lab is a few miles away from Nashville, Tennessee looking at the map it shows that this area is on the lower risk side of the earthquake risk in the United States, yet there still can be earthquakes.
I am from
My families cabin is located in the Sangre de Cristo Mountains in the south-central section of Colorado, in this mountain range there has been no recorded seismic activity in the area. However, in Eastern Colorado there is a few epicenters- in the Platte and the Arkansas River Valleys. The most quakes in the history of Colorado have been in the area of the Rocky Mountain Front Range.
This is a Rocky Mountain Front Range
The worst earthquake that ever caused damage to my precious Denver happened in 1882, November 7th. On the Richter scale the magnitude produced was estimated to be about six point six. This caused damage in many historical buildings in Colorado. This earthquake was felt in Utah, Kansas, it was a very big earthquake for Colorado.
Since 1882 there have been about 500 earthquakes in Colorado, this is small compared to California because it has about 50,000 earthquakes a year. This means that Colorado is on the lighter end to when earthquakes occur, this is a very good advantage to living in Colorado.